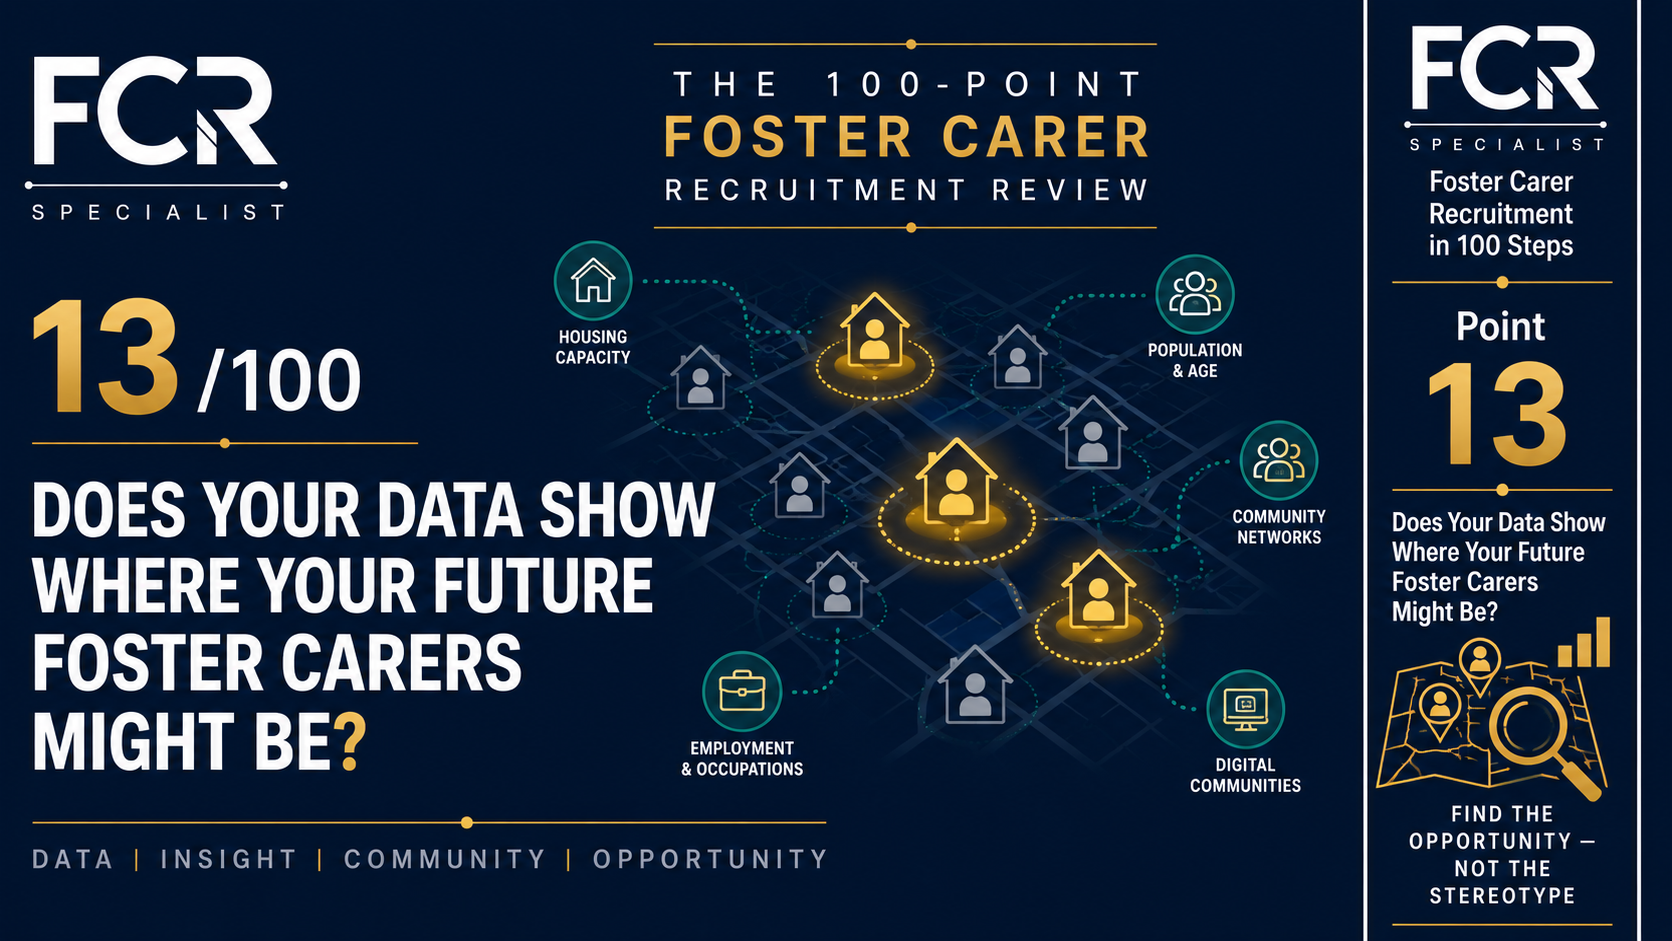
Point 13/100 Does Your Data Show Where Your Future Foster Carers Might Be?
Point 13/100 — The 100-Point Foster Carer Recruitment Review
Point 13/100 — The 100-Point Foster Carer Recruitment Review
Point 11 asked:
Which Foster Carer sufficiency gaps are you actually trying to fill?
Point 12 asked:
Where would you deliberately like to build that capacity?
Now we arrive at the obvious challenge.
Are there actually people in those areas worth starting a fostering conversation with?
That is where data enters the recruitment process.
And I think this is an area where Foster Carer Recruitment can become significantly more sophisticated.
Not through complicated data science.
Not by attempting to predict which individual will become a Foster Carer.
And certainly not by designing a narrow demographic stereotype of the "perfect Foster Carer".
But by bringing together information that most organisations either already possess or can obtain relatively easily.
The objective is simple:
Stop treating every square mile of your recruitment area as though it contains exactly the same recruitment opportunity.
START WITH YOUR EXISTING FOSTER CARERS
Before looking outside the organisation, look inside.
Where do your existing Foster Carers live?
Put them on a map.
Not their names.
Not information that needs to be circulated unnecessarily.
For strategic analysis, aggregated locations are enough.
Then look for patterns.
Do you already have clusters?
Are there towns producing noticeably more Foster Carers than others?
Are there areas you have recruited from successfully over many years?
Are there large parts of your operational geography where you have almost none?
Are some Foster Carers isolated?
Do particular areas contain carers who are especially engaged with the service and potentially willing to support recruitment?
And then ask one of my favourite recruitment questions:
Why?
Why might Town A have produced fifteen carers while a demographically similar Town B has produced two?
Perhaps the answer is historical.
Perhaps a particularly active Foster Carer referred several others.
Perhaps there was once an excellent local recruiter.
Perhaps your office used to be there.
Perhaps you had visibility in the local community.
Perhaps one successful recruitment event created a network effect.
Or perhaps nobody knows.
Either way, the map has created a question worth investigating.
THEN ADD THE SUFFICIENCY MAP
Point 11 established that recruitment should begin with the capacity children actually need.
So now add another layer.
Where are the children and placement requirements behind your sufficiency pressures?
Not individual children displayed on a recruitment map.
Aggregated strategic information.
Which localities repeatedly generate placement pressure?
Where is keeping children closer to school, family or existing relationships particularly difficult?
Which areas would benefit from additional local Foster Carer capacity?
Now compare that with the existing-carer map.
You may find somewhere that looks strategically obvious.
For example:
High placement need.
Very few existing Foster Carers.
Potential population opportunity.
That could become a priority recruitment territory.
Or:
High existing Foster Carer concentration.
Strong community relationships.
Capacity for the cluster to grow further.
That might suggest a different strategy.
This is what data should do.
Not make the decision for you.
Make better questions visible.
NOW ADD POPULATION AND HOUSING DATA
This is where publicly available data becomes extremely useful.
The ONS Census 2021 datasets allow analysis of housing and household characteristics at multiple geographic levels, including Local Authority and smaller statistical areas. Available information includes household composition and the number of bedrooms in accommodation.
For Foster Carer Recruitment, that creates obvious areas for investigation.
Where are there concentrations of:
- three-bedroom and larger homes?
- households with additional bedroom capacity?
- owner-occupied properties?
- different household types?
- one-person households?
- couples whose children may have left home?
- older populations?
- particular employment profiles?
But there is a crucial distinction.
A larger house is not a Foster Carer.
Bedroom data identifies potential housing capacity.
Nothing more.
ONS found that in Census 2021, 68.8% of households in England had more bedrooms than its occupancy standard required.
That is interesting from a recruitment-planning perspective.
But it does not mean 68.8% of households have a bedroom suitable or available for fostering.
A bedroom may be:
an office,
used by family members who visit,
required for other reasons,
or simply not something the household is willing to offer.
So data narrows the search.
It does not determine suitability.
That principle should run throughout Point 13.
AGE CAN BE USEFUL — BUT NOT IN THE WAY YOU MIGHT THINK
The current Foster Carer population itself tells us something interesting.
Ofsted's latest published figures show that the largest group of approved mainstream Foster Carers in March 2025 were in their 50s, accounting for 37%. Around a third were aged 60 or over. Among those newly approved during the year, however, the largest group were in their 40s, at 31%.
That does not mean:
"Target everyone aged 40–59."
It means age is a useful strategic variable to understand.
You might ask:
Where are there populations entering a stage of life where circumstances are changing?
Where are existing carers ageing?
Where might replacement capacity eventually be needed?
Does our current Foster Carer population look dramatically different from the wider population we serve?
Are there age groups we have almost never communicated with effectively?
The purpose is exploration.
Not stereotyping.
OCCUPATION DATA CAN ALSO OPEN DOORS
ONS Census data also provides detailed information about occupations at Local Authority level, including patterns of full-time and part-time working and occupational groups.
Again, this should not turn into:
"Teachers make good Foster Carers."
or:
"Nurses are our target audience."
That is far too simplistic.
Instead ask:
Where are concentrations of people working within occupations or sectors with which we might sensibly build relationships?
For example:
education,
health,
social care,
public services,
large local employers,
self-employment,
community-facing professions.
The opportunity may not even be that the employee becomes a Foster Carer.
They may become:
an advocate,
a referrer,
a supporter,
an introducer,
or somebody who carries the fostering conversation further into the community.
That distinction matters enormously.
DATA CAN HELP US SEE WHO WE ARE NOT REACHING
There is another valuable use of population data.
Compare the communities represented among your existing Foster Carers with the communities living within your operating area.
Are there significant gaps?
That should create curiosity.
Not assumptions.
One example is LGBTQ+ communities.
Census 2021 was the first census in England and Wales to include a voluntary sexual-orientation question, giving considerably more detailed geographic information about people identifying as lesbian, gay, bisexual or another sexual orientation. The ONS also cautions that response rates vary and that the figures describe how people answered the voluntary question rather than every aspect of identity or relationships.
The recruitment question is therefore not:
"How do we target gay people?"
I would strongly resist that approach.
The more intelligent questions are:
Do LGBTQ+ people see themselves in our fostering proposition?
Are we visible in the organisations and networks they trust?
Does our website communicate inclusivity credibly?
Are our existing Foster Carers representative?
Have we built relationships with relevant community organisations?
Do people in those communities know that fostering is open to them?
That is community intelligence rather than demographic exploitation.
And the same principle can be applied thoughtfully to other communities currently underrepresented within your Foster Carer population.
PHYSICAL GEOGRAPHY IS ONLY HALF THE MAP
Traditionally, recruitment geography meant:
Where does somebody live?
Today that is only part of the answer.
There are really two geographies.
PHYSICAL GEOGRAPHY
Where people:
live,
work,
shop,
socialise,
go to school,
attend groups,
use local services,
and participate in community life.
And then:
DIGITAL GEOGRAPHY
Where they:
read,
search,
follow,
listen,
watch,
ask questions,
join groups,
share experiences,
and observe conversations online.
The two overlap, but they are not the same.
A person may live in Huddersfield but spend a large part of their digital community life inside:
professional groups,
parenting communities,
local Facebook groups,
hobby communities,
LGBTQ+ networks,
faith networks,
neighbourhood groups,
sports communities,
professional forums.
That is geography too.
DIGITAL GEOGRAPHY IS BECOMING MORE IMPORTANT — AND MORE SUBTLE
Ofcom's 2026 research found that 89% of adult internet users used at least one social-media platform. But it also found that active posting, commenting or sharing had fallen: around 49% of adult social-media users said they actively did those things, compared with 61% in 2024.
There is an important recruitment inference from that.
A community does not have to be visibly noisy to be influential.
Someone may rarely post in a local group.
They may still read it every day.
They may see:
a Foster Carer's story,
a local information event,
a community organisation supporting fostering,
a discussion about children's services,
or a neighbour sharing your content.
So digital community recruitment should not be measured solely by:
likes,
comments,
shares.
Visibility matters too.
Trust matters.
Repeated exposure matters.
Being present in the places people already gather matters.
THIS IS WHERE MARKETING PERSONAS CAN GO WRONG
Marketing teams often build personas.
Something like:
Sarah, 52.
Homeowner.
Married.
Children have left home.
Works part time.
Three-bedroom house.
There may be some usefulness in understanding common characteristics.
But there is also a danger.
Sarah can quietly become:
"This is what a Foster Carer looks like."
And everyone who does not resemble Sarah receives less attention.
That would be a serious strategic mistake.
A 32-year-old single person might become an exceptional Foster Carer.
So might a same-sex couple.
A renter.
Someone without children.
Someone changing career.
Someone from a community from which you have historically recruited very few people.
Data should open the market.
Not close it.
THINK IN TERMS OF PROPENSITY, NOT CERTAINTY
Perhaps the best way to think about population intelligence is:
Where might the conditions exist for us to start more productive conversations?
That is very different from:
Who will become a Foster Carer?
No dataset can answer that second question reliably.
Fostering is too human.
Motivation matters.
Life experience matters.
Relationships matter.
Household circumstances matter.
Timing matters.
Confidence matters.
Values matter.
And we will begin examining those human factors properly from Point 15.
For now, data simply helps us decide:
Where should we look more closely?
BUILD A RECRUITMENT OPPORTUNITY MAP
So here is a practical exercise.
Take the geography identified in Point 12.
Now create layers.
Layer 1 — Existing Foster Carers
Where are they?
Layer 2 — Sufficiency Need
Where would additional capacity be most valuable?
Layer 3 — Housing
Where are larger homes and areas of under-occupation?
Layer 4 — Population
Age, household composition and relevant demographic patterns.
Layer 5 — Employment
Where are significant employers and occupational communities?
Layer 6 — Community
Which local groups, organisations and networks exist?
Layer 7 — Underrepresented Communities
Who lives in the area but is barely visible within your existing Foster Carer population?
Layer 8 — Digital Geography
Where do these communities communicate and gather online?
Now stand back.
Where do several layers overlap?
That is where the conversation becomes interesting.
HERE IS THE TEST
Imagine I walked into your fostering service and said:
"Show me the evidence for why you are spending more recruitment money in Area A than Area B."
What would you show me?
An advertising platform telling you Area A has historically generated cheaper leads?
That's useful.
But it is only one data point.
Could you also show me:
sufficiency pressure?
existing Foster Carer distribution?
housing?
population?
community networks?
local partnerships?
digital communities?
historic conversion?
If you can, you have moved from advertising data to market intelligence.
That is a much stronger position.
FOSTER AND FOUND MEET HERE
This Point is where two elements of my work begin naturally to overlap.
FOSTER — Find
continues asking:
Where is the need?
Where should capacity exist?
Where might the people be?
And the FOUND Framework introduces the importance of:
Data & Structure
and:
Findability.
Because understanding an audience is one thing.
Making sure they can actually encounter, recognise and find your fostering proposition is another.
That comes later.
For now, the objective is intelligence.
Point 13 does not tell us to advertise.
It tells us where we might have the greatest opportunity.
And Point 14 turns all of this into something operational:
HAVE YOU TURNED YOUR AUDIENCE MAP INTO A RECRUITMENT TERRITORY PLAN?
100 points.
10 stages.
One end-to-end examination of Foster Carer Recruitment.